Text to SQL Analytics
Text to SQL Analytics somebodyText to SQL Analytics
SQL stands for Structured Query Language. It's a programming language used to interact with databases. SQL allows you to query, analyze, and transform data stored in databases.
Traditionally, writing SQL queries requires some programming knowledge. You have to learn SQL syntax and compose queries using code.
Text-to-SQL changes this by letting you query data using plain English. Instead of coding SQL statements, you just type natural language questions.
For example, you could ask "What are the most popular topics people have asked about this month?" The text-to-SQL engine will automatically translate this to an SQL query.
This makes data analytics much more accessible to non-programmers. You don't need any technical skills. Just ask questions in everyday language.
The text-to-SQL system handles the complex work behind the scenes of parsing your question, understanding intent, and translating it into optimized SQL code.
So in essence, text-to-SQL democratizes access to data. Anyone can get insights by querying data conversationally using simple English questions rather than programming code.
It makes data analytics much more inclusive, intuitive and user-friendly especially for non-technical users. You get the power of SQL without learning a programming language.
Advantages of Using Natural Language to Generate Reports
- Natural language queries - Users can analyze data by typing simple plain English questions rather than complex Boolean search queries.
- Conversation interface - The text-to-SQL system allows interacting with the data in a conversational manner by clarifying questions.
- No coding needed - Users don't need to know SQL. The text-to-SQL engine handles translating questions to SQL behind the scenes. Accessibility - The natural interface opens up data access and analytics to non-technical users.
- Agility - Quickly get answers to ad-hoc analytical questions by typing them, no need to submit requests to BI teams.
- Democratization of data - Enabling more stakeholders to directly query and analyze data by using natural language.
- Unified semantics - The text-to-SQL mapping understands synonyms and equivalent phrasing, creating a unified semantic layer.
So in summary, for this use case text-to-SQL delivers a much more accessible, intuitive and conversational analytics experience compared to traditional Boolean search or coded SQL queries. The natural interface makes AI-driven analytics much more inclusive.
Overall Advantage of Easy Access to Analytics
- Flexibility - SQL allows you to join, aggregate, filter, and transform data in many ways to generate insights. It's more flexible than restrictive "canned" reports.
- Customization - SQL queries can be customized to answer specific business questions. Reports can evolve as needs change.
- Automation - SQL queries can be scheduled and automated to run periodically without manual effort.
- Performance - Databases are optimized for performing fast aggregations and joins to analyze large datasets.
- Skills - SQL skills are widely available compared to proprietary reporting tools. Easier to find people to build and modify reports.
- Data governance - SQL analysis leverages the security, access control and governance of the database platform.
- Scaling - SQL platforms provide ways to scale out analytics to large data volumes like parallel execution and clustering.
- Integration - Easy to integrate results of SQL queries with other systems like dashboards, apps and predictive models.
The key advantage is flexibility - SQL provides the building blocks for creating a wide variety of reports and insights by mashing up, filtering, and transforming data in many creative ways.
Advantages Specific to Real Estate Books AI Reporting
REBAI makes two tables available for analytics reporting:
- Query log table
- User log table
Here are some report ideas that could be generated from these tables:
- Daily token usage by user - Shows the number of tokens used by each user per day. This could help track heavy users and identify potential issues.
- Monthly token usage by user - Same as above but summarized by month. Useful for billing or limiting users.
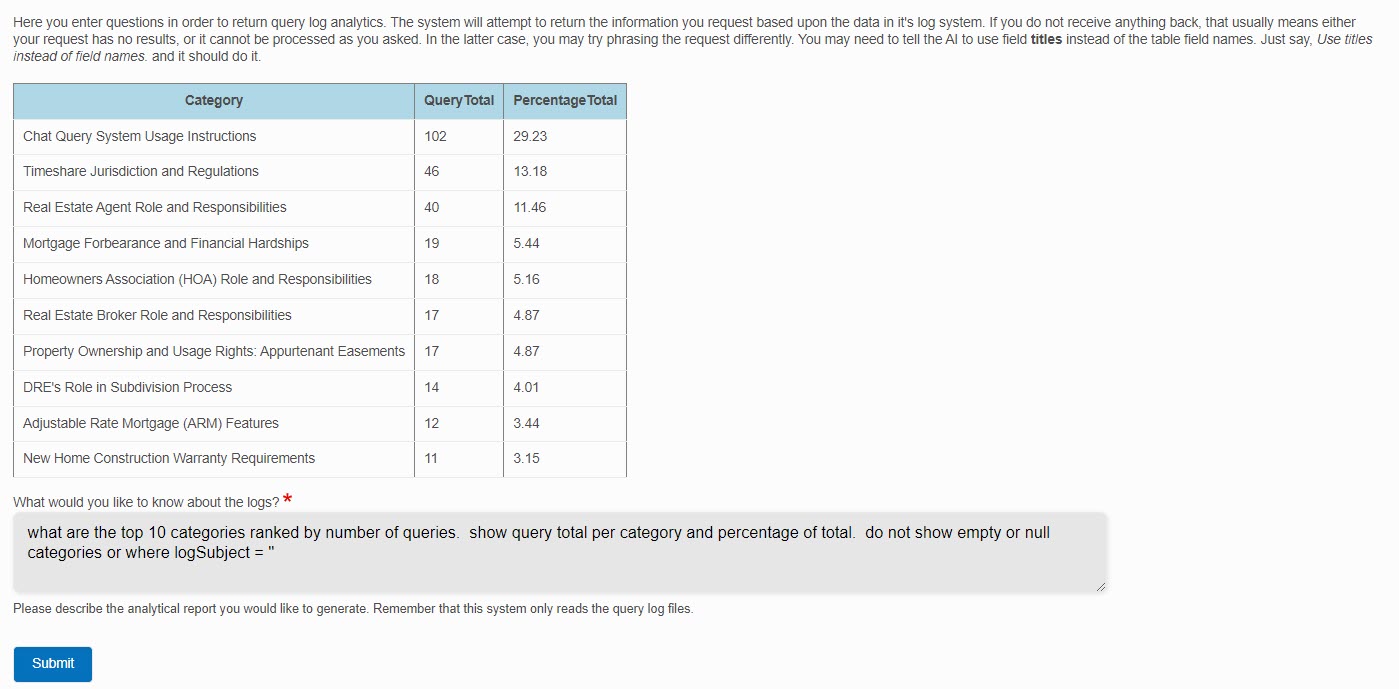
- Queries by category - Shows the number of queries categorized into each subject area. Helps identify popular topics.
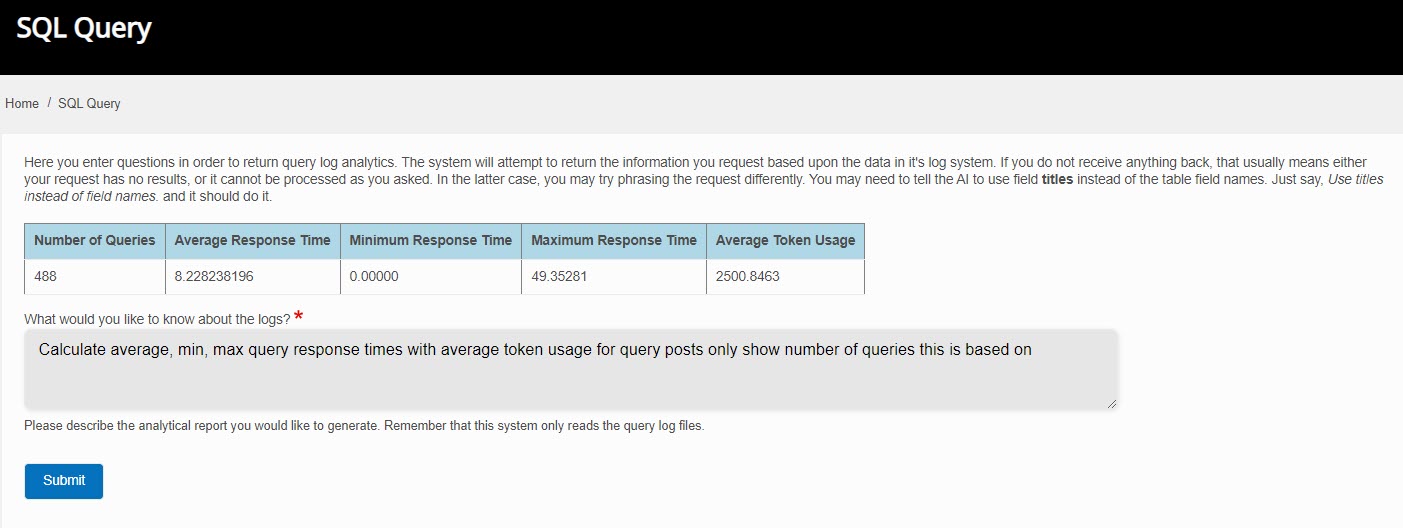
- Query response times - Calculates average, min, max query response times. Measures system performance.
- Top models by usage - Shows the number of queries processed by each AI model. Helps track model usage.
- User logins by source - Shows number of logins from site, email, SMS. Measures engagement.
- Ranked vs unranked queries - Compares number of ranked vs unranked queries over time. Tracks ranking progress.
- Queries by user - Shows number of queries performed by each user. Identifies highly engaged users.
- Daily active users - Tracks number of unique users performing queries each day. Measures daily engagement.
- Email usage - Shows number of queries by email vs other sources. Track email channel usage.